Atmospheric Balloon
Ecole Polytechnique second year scientific research project
The physics of the atmosphere, and the electrical circuit it constitutes, are active research topics. More specifically, the conductivity and electric field of the atmosphere are the subjects of theoretical models and experimental measurements. Atmospheric physicists are interested in thunderstorms, the phenomena they generate, and their impact on the global electrical circuit of the atmosphere. Research on the role of more complex discharge phenomena such as Transient Luminous Events and Terrestrial Gamma Ray Flashes is also very important, as well as electromagnetic waves like Schumann resonances.
The use of atmospheric balloons is particularly well-suited for studying these physical phenomena. They allow for the exploration of an altitude range where most of the mechanisms responsible for atmospheric electricity and the direct causes of many associated phenomena occur. Two French research programs using balloons are currently being conducted under the auspices of CNES: the general STRATEOLE-2 program and the STRATELEC program.
Our project follows the continuity of the STRATEOLE-2 and STRATELEC programs, in partnership with the Atmosphères, Observations Spatiales (LATMOS) laboratory, and aims to test and develop a prototype of a gondola, as well as its instrumentation, for use in certain CNES missions.
Measurements

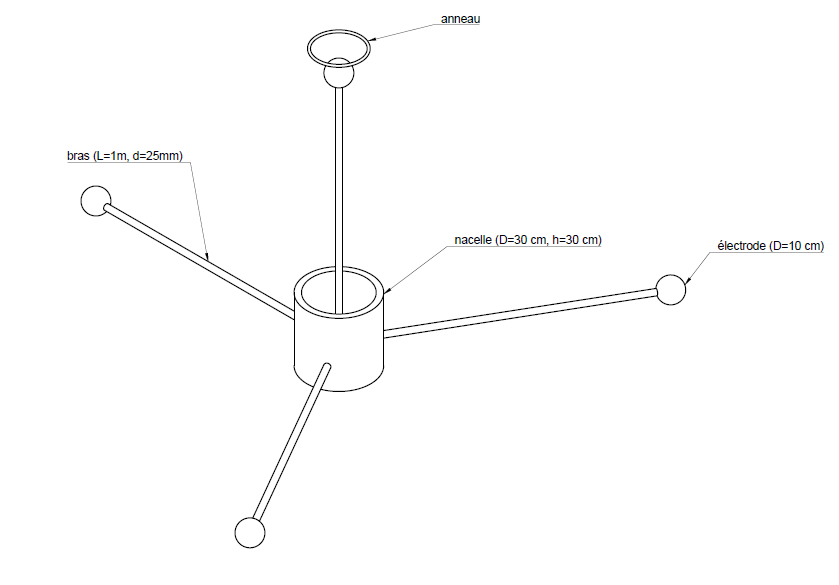
The measurement of the three components of the atmospheric electric field, both AC and DC, represents the "baseline" measurement of atmospheric electricity. The objective is to measure the intensity and direction of the field, the altitude profile, the disturbances caused by clouds, and to allow comparison with the conductivity profile. The proposed method relies on the use of four spherical electrodes as indicated in the associated diagram
Three electrodes in the XY plane are used to measure the horizontal components of the electric field. These are connected to the gondola by 1-meter-long fiberglass arms. A final electrode measures the vertical component of the electric field.
The issue of the gondola’s rotation was raised, as it helps to correct measurement differences due to the potential surface differences of the electrodes. Even though these differences are potentially small, on the order of a few hundred millivolts, they could play a non-negligible role, as the horizontal electric field is also weak.
Conductivity To measure the conductivity of the atmosphere, a relaxation method can be used. One of the electrodes is displaced from its equilibrium potential at regular intervals. The conductivity is related to the time it takes for the electrode to return to its equilibrium potential, which will be measured. The measurement of conductivity in this way is interesting because, in addition to the fact that few measurements have been made so far, it would allow us to observe if there are any local variations during cloud crossings or due to urban pollution.
Let us seek a relationship between the relaxation time of a charged conductor and the conductivity of the surrounding medium. In an isotropic conductive medium, Ohm’s law, along with charge conservation and the Maxwell-Gauss equation, allows us to obtain: \(\rho = \rho_0 e^{-\frac{\sigma t}{\epsilon_0}}\)
Thus, we obtain the time constant: \(\tau = \frac{\epsilon_0}{\sigma}\), with \(\sigma\) is the conductivity of the atmosphere in \(\Omega^{-1}, \text{m}^{-1}\), and \(\epsilon_0\) is the dielectric permittivity of free space.
Considering a spherical electrode at the end of an insulating arm, with a charge \(Q\), the electric field at a distance much greater than \(R\) (the radius of the sphere) is given by: \(E = \frac{Q}{4 \pi \epsilon_0 R^2}\). Using Ohm’s Law and the previous result, we get, for an excitation by a potential \(V_0\) of the electrode at \(t = 0\) produces a potential for \(t > 0\) of:
\[V = (V_0 - V_{\text{eq}}) e^{-\frac{\sigma t}{\epsilon_0}} + V_{\text{eq}}\]This allows us to obtain the conductivity by measuring the relaxation time relative to the potential \(V_0\) applied to the electrode until it reaches equilibrium \(V_{\text{eq}}\).
The role of dust in the atmosphere, its electrification, and its consequences on lightning triggering mechanisms, meteorology, and the transport of particles over long distances are still poorly understood \cite{ref1}.
Charged aerosols Electrified dust, particularly during episodes such as those periodically observed, bringing particles from the Sahara Desert for example, generate pulses upon impact with the electrodes. It is important to measure this impact, whose amplitude is proportional to the charge, in order to better understand these phenomena.
Schumann resonances and other EMR The measurement of Schumann resonances, as well as other signals generated by lightning or ground-based emitters, is a way to verify the correct operation of the measurement chain.
Mechanical structure of the gondola
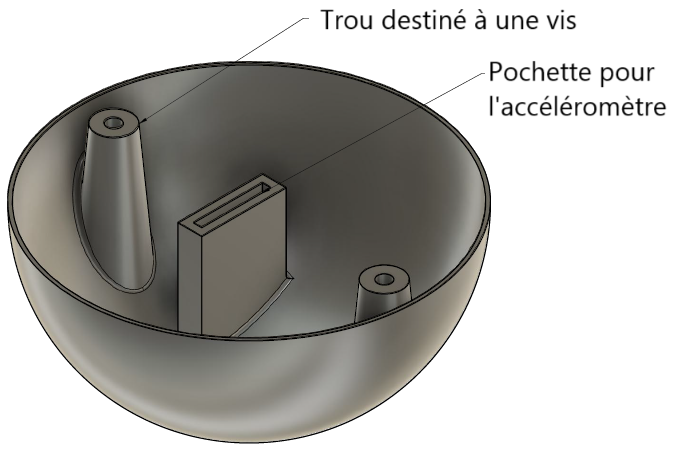
The atmospheric temperature profile and the flight conditions impose the following constraints on the gondola:
- It must contain all the electronics.
- It must not exceed a total weight of 3 kg (including its contents, the arms it supports, the electrodes, and the M10 radiosonde attached to it).
- It must be fragile enough to break in case of a collision with an airplane.
- It must absorb shocks to some extent during its fall.
- It must thermally insulate the electronics inside, as the temperature can drop to -56°C at an altitude of 12 km.The normal operating temperature of the batteries ranges between 0°C and 45°C, and it is not recommended to use them below -20°C.
The electrodes, which are the measurement instruments of the system, require special attention:
- They must be made of a conductive material, such as metal.
- The four electrodes must have an identical smooth spherical external surface to ensure uniform conductivity.
- Each electrode must house an accelerometer inside to detect potential parasitic noise.
Finally, the arms are among the least constrained elements:
- They must be lightweight.
- They must be strong enough to support an electrode at the end without breaking
To address the constraints of weight, thermal insulation, and measurement accuracy, the final design choices for the nacelle and its components were as follows: The nacelle was constructed from 5 cm thick polyurethane foam, cut into a hollow cylindrical shape, achieving a weight of 860 g while ensuring adequate insulation for maintaining a temperature of 0°C internally. Heating was provided by a dissipation system delivering 8 W, compensating for external temperatures of -56°C during ascent. The electrodes were ultimately coated with graphite-based conductive paint to ensure consistent surface potentials while avoiding the impracticalities of ABS-conductive material and aluminum manufacturing costs. Fiberglass arms of 1 m length connected the nacelle to the electrodes, with nylon strings for added stability, and an annular structure prevented tangling with the attachment lines.
Electronics and Instrumentation
The main challenge of this project lies in the development of an instrumentation capable of:
- Adapting to the range of electrostatic potentials in the stratosphere (up to several hundred volts) and its disturbances, particularly those of meteorological origin.
- Successfully discriminating signals of lower amplitude (Schumann resonances, medium electrostatic and electromagnetic fields, and atmospheric disturbances).
- Finally, processing these signals efficiently in digital form with sufficient precision to highlight the aforementioned phenomena.
The embedded electronics are therefore made up of three stages:
- High voltage analog (Pre-amplifier)
- Low voltage analog filtering
- Low voltage digital processing
While the voltage of the high voltage stage is mainly determined by the external potential, the low voltage corresponds to an amplitude of ±5V. The entire electronics are powered by a battery of the same amplitude (±5V), and the high voltage circuit is powered via a controlled gain converter that we have built. The gain control is crucial to adapt the power supply of the first stage to the external electrostatic conditions.
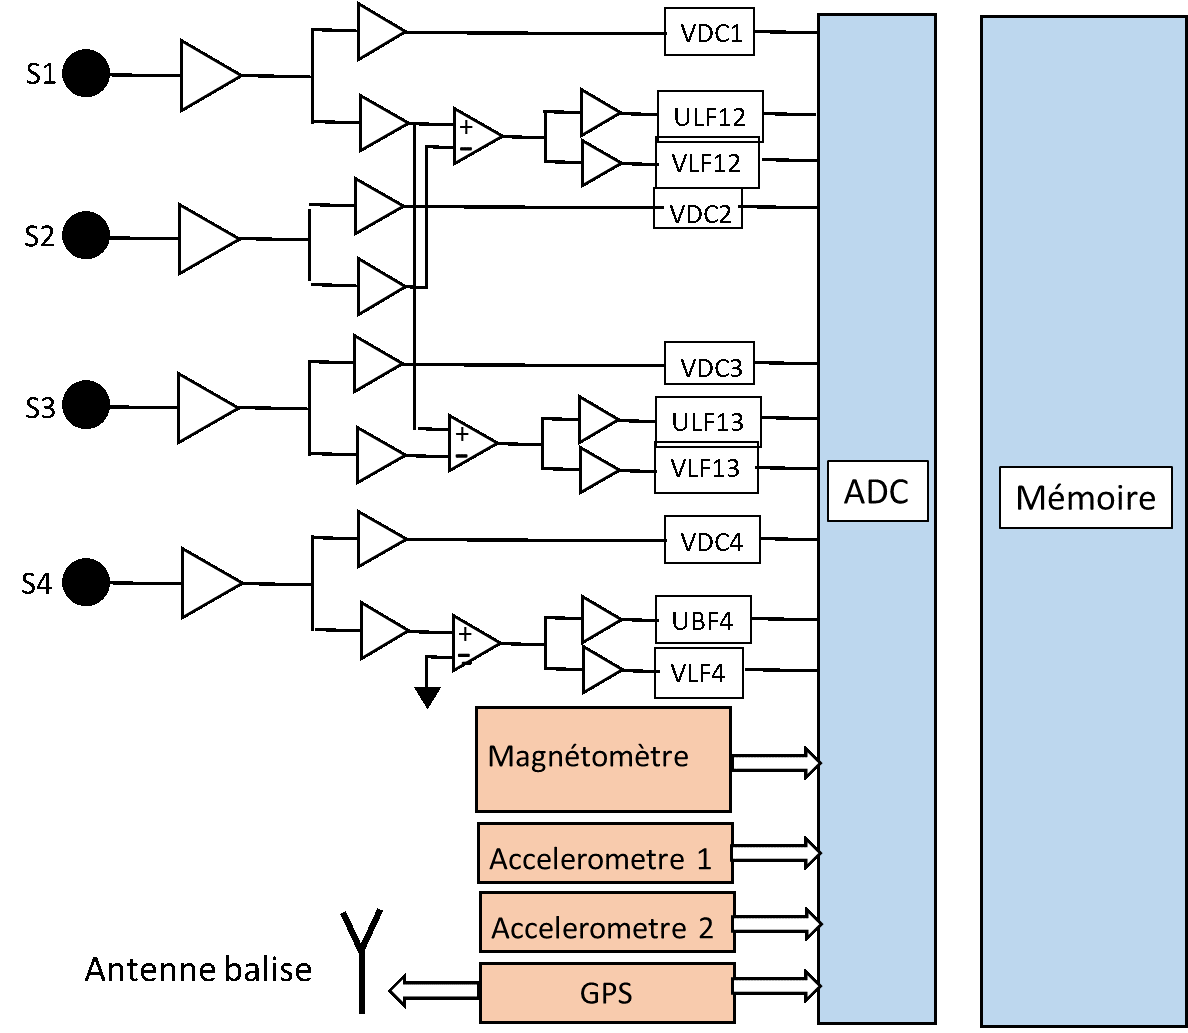
The measurement organization is as follows:
- In addition to the measurements of the DC field (0-3Hz), as well as those corresponding to Ultra Low Frequencies (ULF: 3Hz-45Hz, Schumann resonances) and Very Low Frequencies (VLF: 45Hz - 2kHz, lightning-associated signals), the following are also included:
- A magnetometer that allows for the orientation of the nacelle, and thus the components of the AC and DC fields in a reference frame linked to the Earth.
- A GPS probe that provides the altitude of the nacelle and allows it to be tracked during the flight for safety purposes.
- Three-axis accelerometers added to the arms to measure parasitic vibrations, which could interfere with the measurement of Schumann resonances.
The preamplifier
the role of the preamplifier is primarily to measure the potential of the electrodes without disturbing it. Each electrode is therefore connected by a coaxial cable (inside the arm) to its corresponding preamplifier. The preamplifier first requires a very high input impedance, as the resistance of the atmosphere, \(R_p\), is also very high. Thus, if our input impedance \(R_{in}\) is smaller than \(R_p\), the voltage divider effect between the two resistances will cause the largest potential difference to be measured across \(R_p\), and the signal measured by the electrode will be heavily attenuated. In the literature, values on the order of \(10^{12} \Omega\) are found for the resistance of the sheath in the atmosphere between 0 and 20 km.
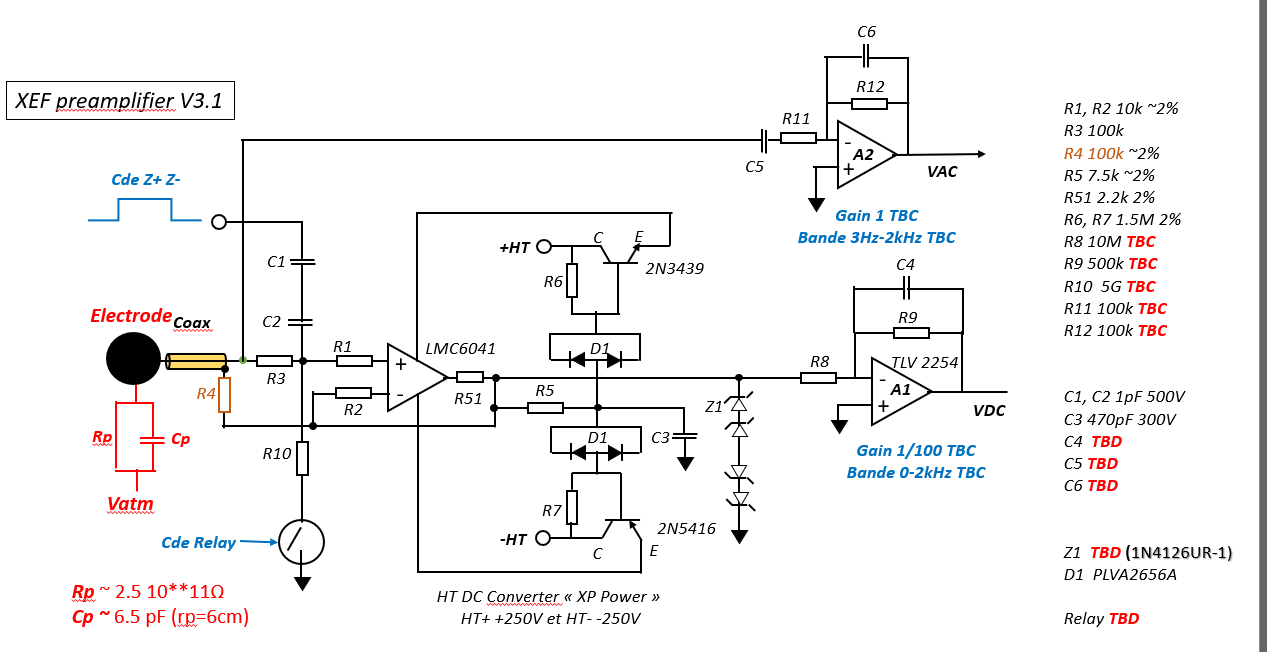
A second circuit is set up for conducting relaxation experiments (Cathode Z+ Z-), periodically displacing the electrode 4’s potential from its resting potential (about every 5 seconds).
Thus, the preamplifier has two outputs: DC and AC (ULF+VLF). Two filters at the output connect the electrode potential to the second analog filtering stage, prioritizing the frequency bands under study. These filters have a static gain of one-twentieth to ensure analog low-voltage processing and avoid parasitic phenomena at the cutoff frequencies, thus uniformizing the processing at the output.
Filtering
The filtering, situated between the preamplifier and the analog-to-digital converter (ADC), must therefore include two main types of outputs: “raw” potentials, studied in direct current (DC outputs), and differential potentials (variable voltage outputs, ULF and VLF), as indicated below:
The three frequency bands studied are:
- DC: Direct current, practically corresponding to the ≤ 3Hz band;
- ULF (3Hz ≤ f ≤ 45Hz): to isolate Schumann resonances;
- VLF (45Hz ≤ f ≤ 2kHz): for the rest of atmospheric disturbances.
Several filters were used for this purpose: Low-pass 3Hz, Subtractors, Band-pass 3Hz - 45Hz, Low-pass 2kHz. It was decided to use, wherever possible, second-order Sallen-Key filters, as recommended by Jean-Jacques Berthelier. Furthermore, to simplify the development of Printed Circuit Boards (PCBs), the use of quads, grouping four filters at a time, proved particularly useful.
Special attention was paid to the subtractor assemblies. Indeed, under calm conditions (i.e., only constant electromagnetic fields and Schumann resonances should be observed), the nominal variable voltage between two electrodes is 200μV in amplitude. However, under stormy conditions (e.g., disturbances, particularly during nearby thunderstorms), this value approaches 10mV.
To study both situations precisely (which can occur during the same flight), it was necessary to design a subtractor with variable gain. Three approaches were investigated (saturation regime amplifier circuit, active switching using a command signal envelope, passive switching using a non-inverting diode circuit in parallel). For simplicity and performance reasons related to integrated circuits (notably the multipliers needed for the active switching system), the passive switching system was chosen.
The system saturates (5V) in stormy conditions and corresponds to an amplitude of 4.5V in calm conditions. Although 0.5V of measurement range is lost in precision, this solution is significantly preferable to a constant gain configuration.
Processing & Sensor integration
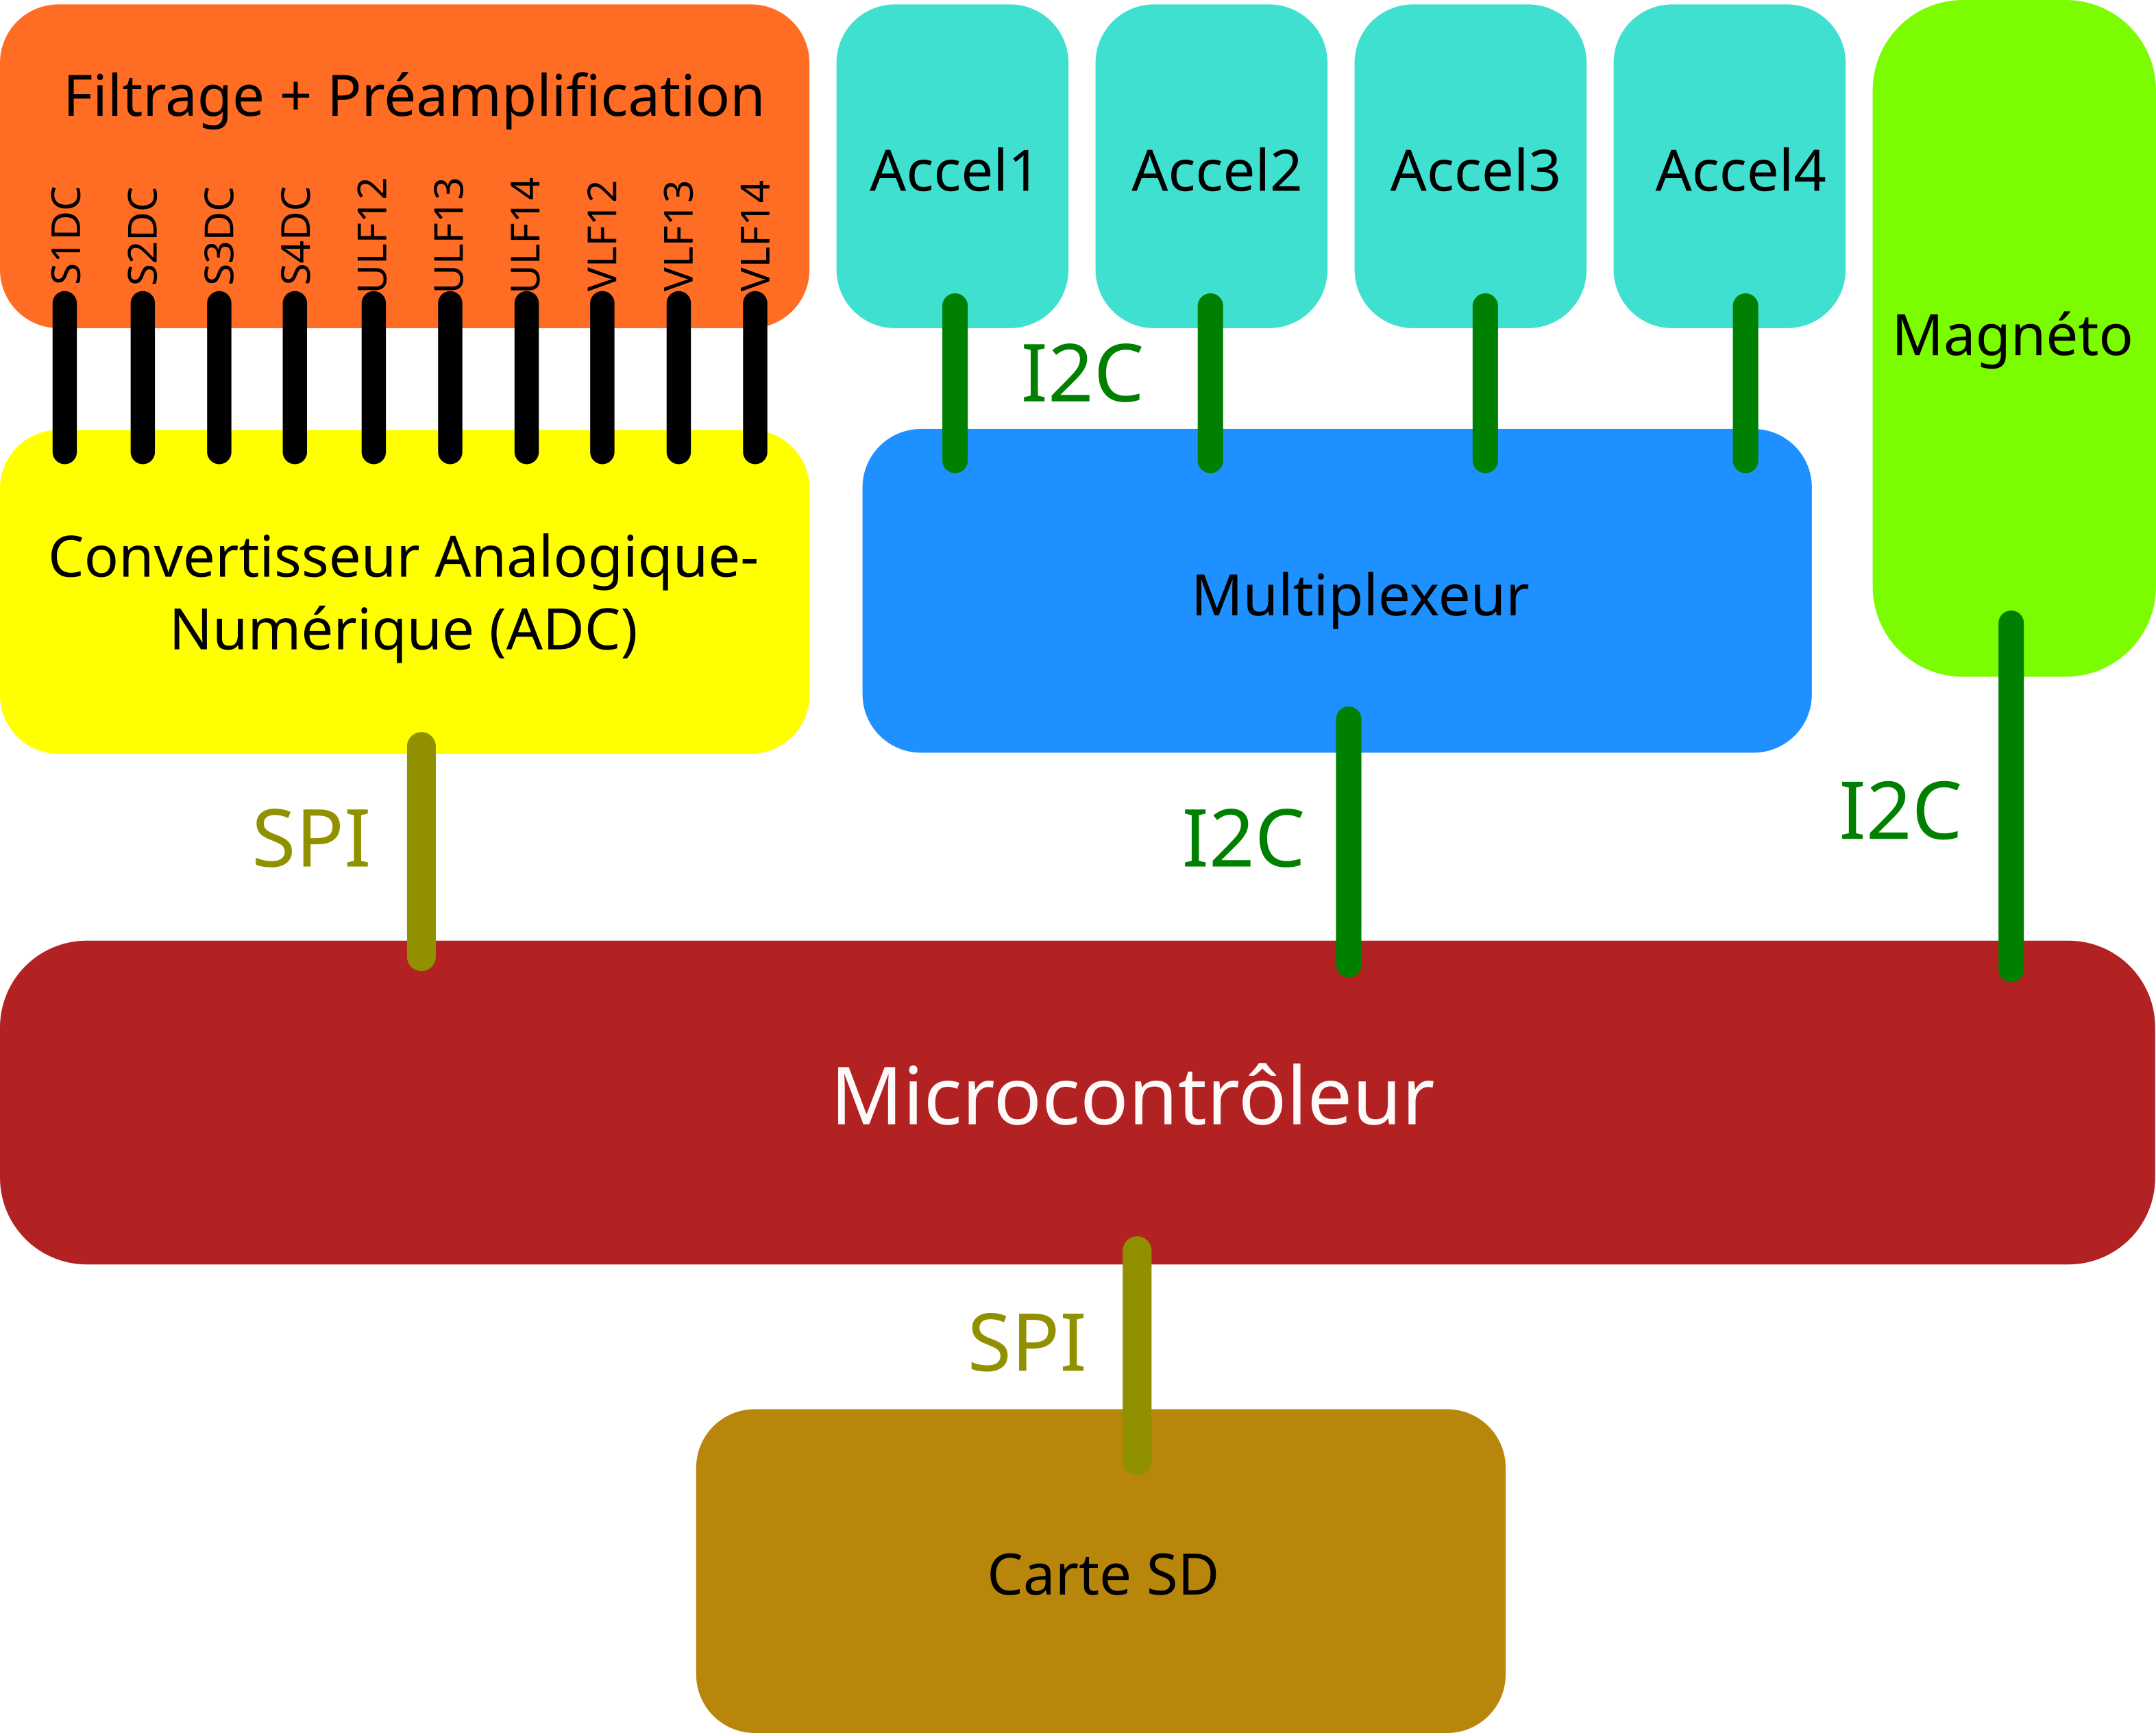
The analog signals from electrodes are amplified and filtered before being sampled by an ADC for processing by the microcontroller. Each signal has its own maximum frequency and sampling rate requirements, with the ADC needing to perform around 13,400 conversions per second. The ADC should have at least 10 inputs, a sampling time under 75μs, and a resolution higher than 14 bits.
The use of the internal ADC of an Arduino Mega 2560 was first tested, which offered 10-bit precision and a minimum acquisition time of 100μs—insufficient for the project’s needs. After adjusting the ADC settings, the acquisition time was reduced to 26μs, but the resolution was still inadequate. A more precise external ADC (MCP3208, 12-bit) was tested, but it faced challenges in accuracy due to poor filtering, leading the team to abandon its use.
Data Storage on SD Card For storing the sampled data, different options were explored :
- Using RAM: A direct approach would fill up the microcontroller’s 8 KB SRAM quickly, making it impractical for long durations.
- Using an SD card: An SD card interfaced via SPI could store data during the flight. However, the write speed of the card (1.9 ms for 8 floating-point numbers) limited the number of samples taken per second, making this option less efficient.
- Using Buffers: Data could be stored in a buffer and written to the SD card in batches, but this did not significantly improve write speeds.
An STM32H7 microcontroller, which offers a faster ADC (16-bit resolution) and a more efficient method for writing data using Direct Memory Access (DMA) was finally considered. However, challenges with time-stamping data for later use remained.
Magnetometer Magnetic Field Approximation and Measurement: The Earth’s magnetic field is modeled as a dipole magnetic moment, \(\vec{m}\), centered along the axis connecting the magnetic poles of the Earth. The magnetic field \(\vec(B)\) at any point outside this dipole is derived using Biot-Savart’s law:
\[\vec{B}(\vec{r}) = \frac{\mu_0 I}{4\pi} \int \frac{d\vec{l}(\vec{r} - \vec{r'})}{|\vec{r} - \vec{r'}|^3}\]For distances much larger than the size of the dipole, this simplifies to: \(\vec{B} = \frac{\mu_0}{4\pi R} \left[ 3(\vec{m} \cdot \vec{r})\vec{r} - \vec{m} \right]\)
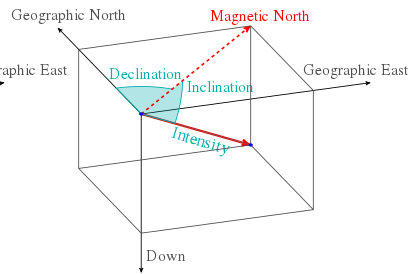
Representation of the Magnetic Field: In the Earth’s coordinate system, the direction and intensity of the magnetic field are characterized by two angles:
- Inclination \(I\) : The angle between the magnetic field and the horizontal plane.
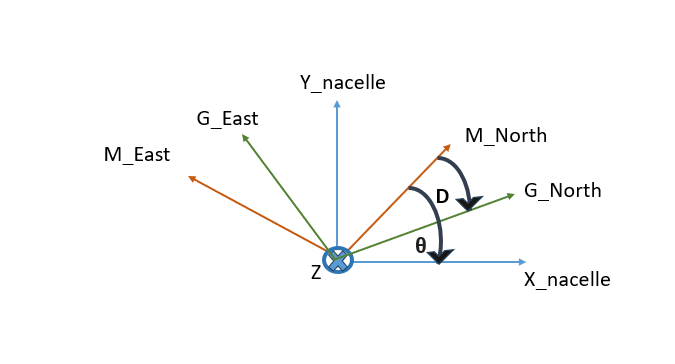
- Declination \(D\) : The angle between the magnetic and geographic North.
The magnetic field in the geographic coordinate system is expressed as:
\[\vec{B} = B_0 \left[ \cos(I)\cos(D), \cos(I)\sin(D), \sin(I) \right]\]Using the Magnetometer: By measuring the magnetic field vector with a magnetometer, the angle \(\theta\) between the X-axis of the magnetometer and the magnetic North can be derived using:
\[\theta = \arctan\left( \frac{B_Y}{B_X} \right)\]After correcting for the declination \(D\), the orientation of the nacelle in the Earth’s coordinate system is obtained using: \(\theta - D \mod 2\pi\)
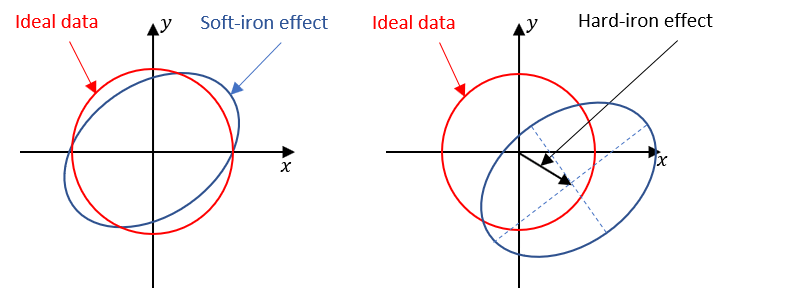
The magnetometer measures the components of the magnetic field, but the readings typically form an ellipsoid rather than a perfect sphere. The distortions are caused by various factors such as instrumental errors and magnetic interferences.
Instrumental errors involve scale factors (represented by a diagonal scaling matrix \(S\)), non-orthogonality of the axes (represented by a matrix \(N\)), and offsets \(b_{so}\).
Magnetic interferences include:
- Hard-Iron distortions (bias vector \(b_{hi}\))
- Soft-Iron distortions (3x3 matrix \(A_{si}\))
The general equation for the measurements, including these distortions, is:
\[\vec{h}_m = S N ( A_{si} \vec{h}_{corr} + b_{hi}) + b_{so}\]or more compactly:
\[\vec{h}_m = A \vec{h}_{corr} + b\]Where \(A = S N A_{si}\) accounts for scaling, alignment, and soft-iron effects.
The calibration aims to convert the distorted ellipsoid into a sphere of radius \(F\). The normalization condition ensures that the corrected measurements form a spherical shape: \(\vec{h}_{corr}^T \vec{h}_{corr} = F^2\)
This leads to a quadratic form representing an ellipsoid. By applying a least-squares algorithm, the parameters for the ellipsoid \(Q\), \(u\), \(j\) which can be estimated. The transformation is performed by:
\[\vec{h}_{corr} = A^{-1} (\vec{h}_m - b)\]Accelerometer Accelerometers are used to measure vibrations of the nacelle’s arms, especially those that might interfere with data collection during flight. The specific accelerometers chosen are MMA8451 accelerometers, which are easy to interface with microcontrollers through the I2C communication protocol. These sensors are mounted on each arm of the nacelle to capture vibrations, particularly in the frequency range of Schumann resonances (0-50 Hz).
-
Communication: The accelerometers use I2C for data transfer, with an important issue being that all four accelerometers had the same address, preventing simultaneous communication. This problem was solved by using a multiplexer, which switches between accelerometers via I2C.
-
Calibration: Like the magnetometer, the accelerometers also require calibration to correct for non-orthogonality of axes. Calibration ensures that the accelerometers provide accurate readings despite environmental influences or sensor misalignments. The calibration process for accelerometers is similar to that of magnetometers, aiming to eliminate distortions from the environment.
GPS The GPS positioning system for tracking the balloon uses a M10 scientific radiosonde. This device sends data (including the GPS position, temperature, wind force, and humidity) to the ground station once every second. Initially, there were plans to add extra sensor data to the transmission using an Arduino, but the data rate would have been too low (only 100 Hz) to handle the 30,000 data points per second generated by the instrumentation.
The radiosonde was chosen because it provides reliable GPS data at a sufficient frequency for tracking purposes. However, transmitting additional data was ultimately deemed unfeasible due to bandwidth constraints.